
Working with the Report Designer in ReflexBlue
Introduction
ReflexBlue uses the Report Designer from Stimulsoft. This tool provides a user-friendly interface that makes it easy to design and edit reports. Text can be directly edited on the report page without the need for opening additional windows. There is also a preview available in a dedicated tab, allowing you to immediately view the report’s result.
Stimulsoft offers comprehensive user documentation for the Report Designer on their website. Visit their website for more information.
The Report Designer in ReflexBlue can be accessed in various ways. For more information, see Editing reports in ReflexBlue.
Report definitions
A report consists of a layout and a dataset. Together, they form a report definition.
-
The layout of the report involves the arrangement and format of the report, such as page size, text, font, and colors used. In the Report Designer, you can find the layout settings on the Properties tab.
-
The dataset of the report pertains to the underlying data from your records that can be used in the report’s layout through fields or variables. In the Report Designer, you can find the dataset in the Dictionary under Business Objects.
The dataset differs for each report. All reports in ReflexBlue contain test data in the dataset that can be used during editing to check the layout in the preview. It’s also possible to edit reports with data from your administration.
Business Objects
The dataset of a report in ReflexBlue consists of a hierarchical tree structure. Below is an example of the Business Objects in a sales invoice report. The elements in the structure are referred to as fields or nodes (a list of fields and/or nodes). A node is a list containing fields and/or sub-nodes.
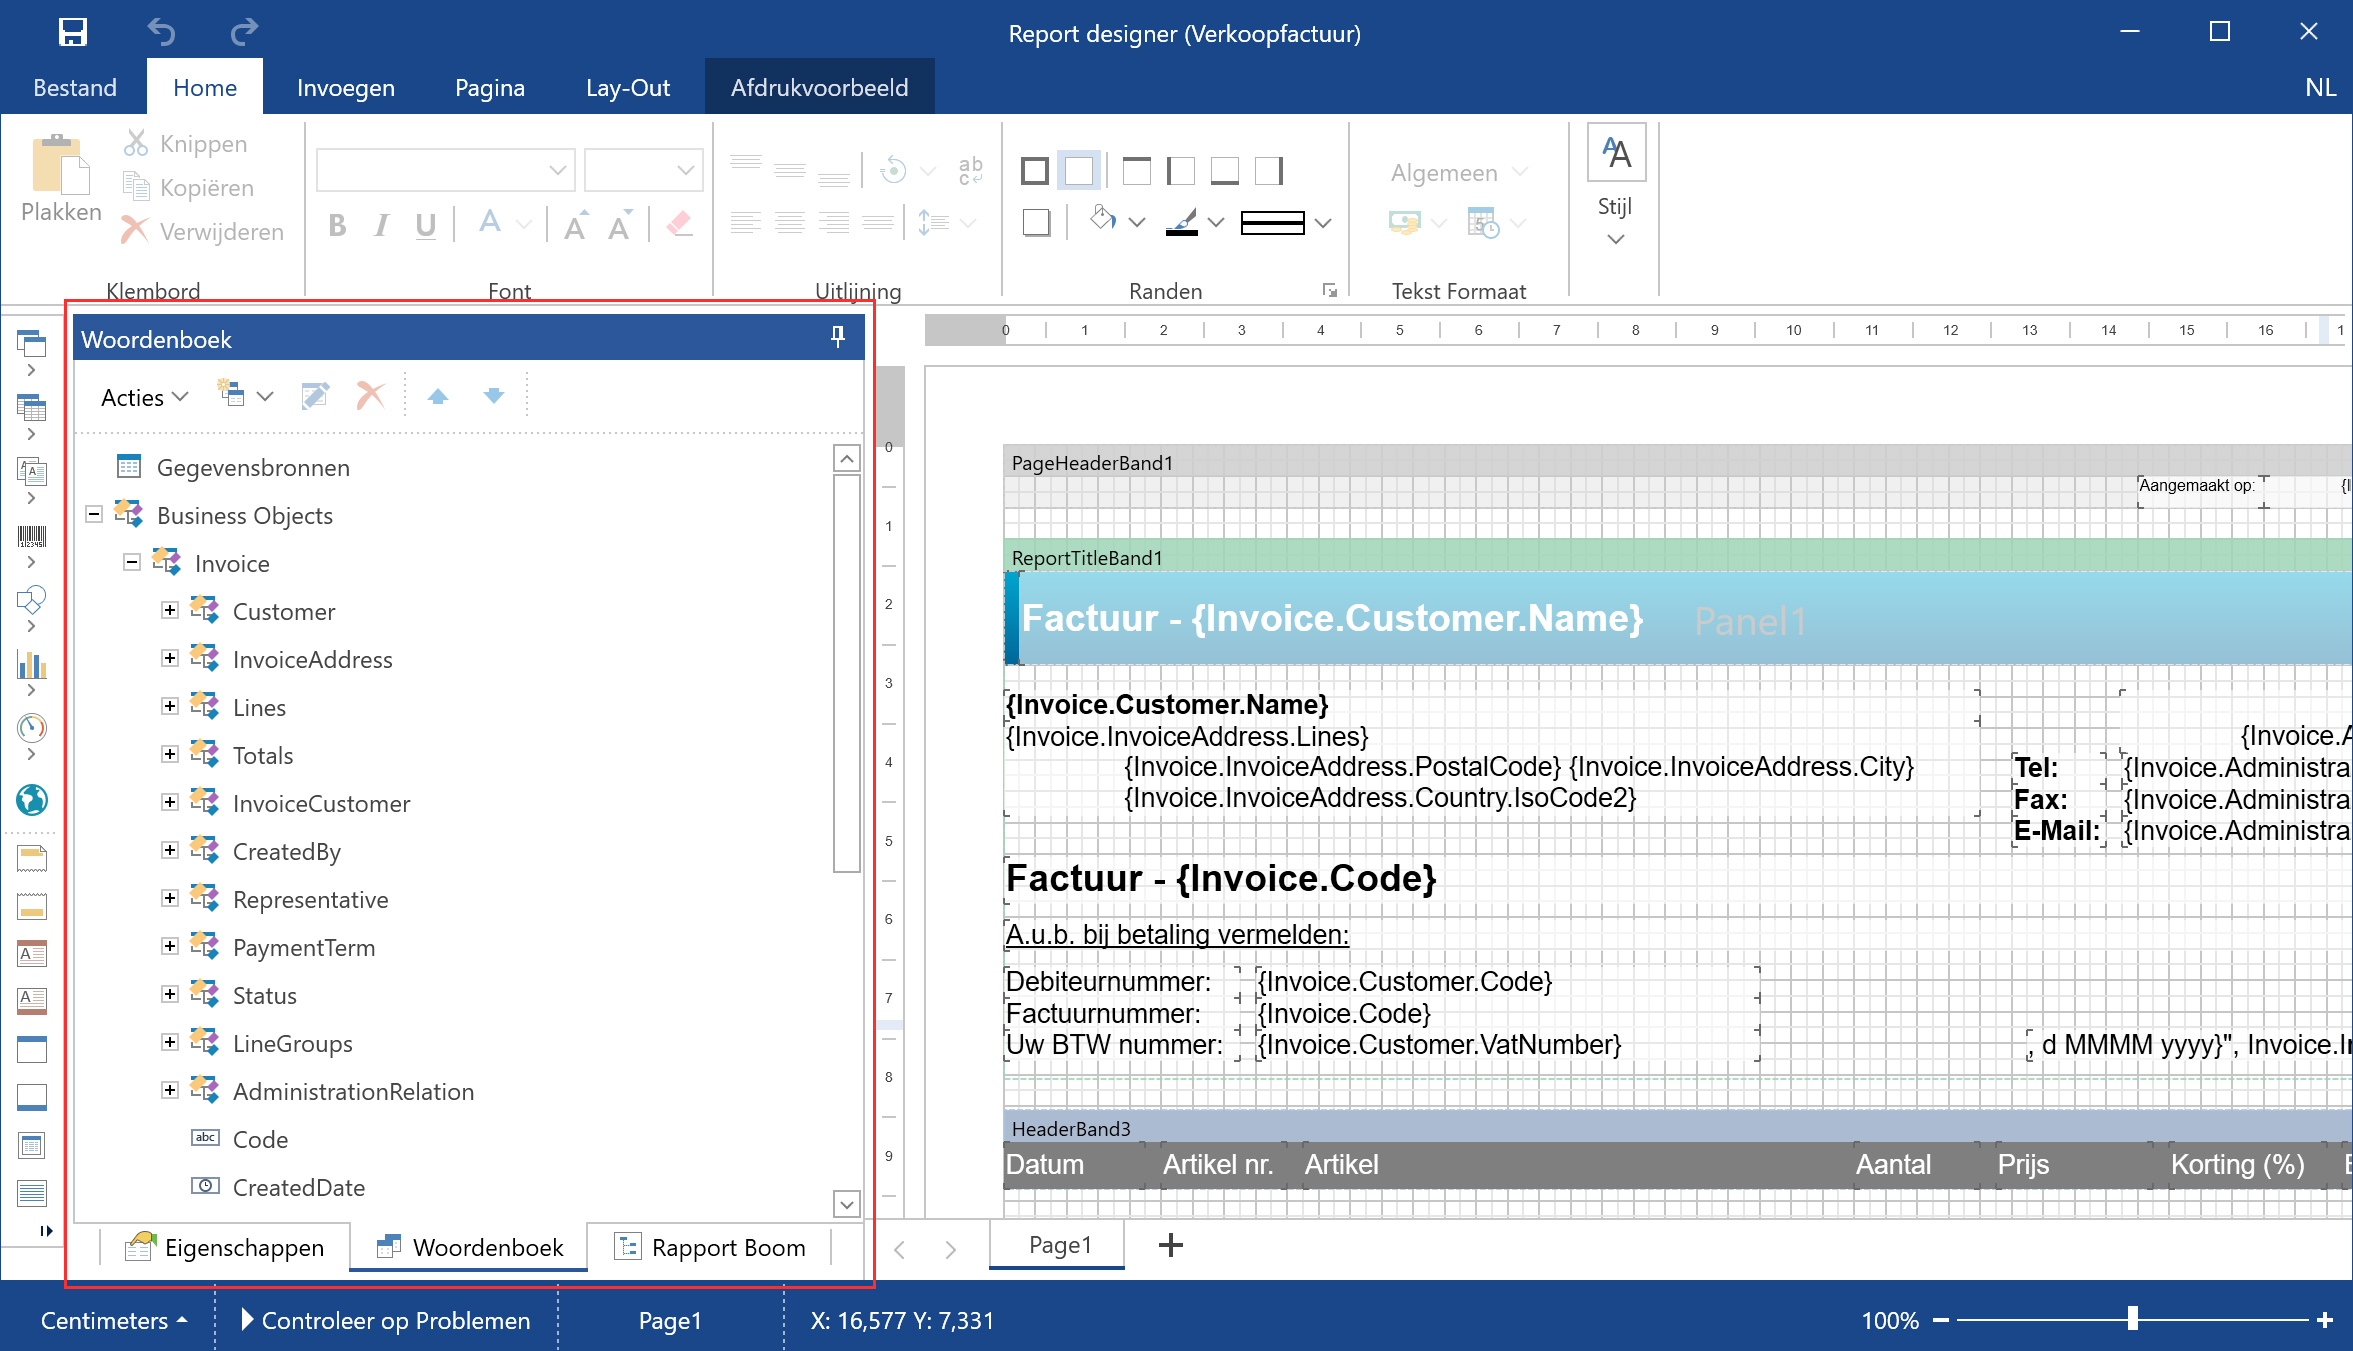
The fields under Business Objects are usually easy to understand based on the field name. For the more complex fields, we provide additional information in our documentation about the data they contain and how they can be used.
Each report in ReflexBlue contains test data that you can use to check the layout in the Report Designer. This test data may be limited or may not contain all data that occurs in an actual report.
If you open the context menu for a field in Business Objects and select View Data, no results may therefore be displayed.
You can also edit a report using the current data from your administration. Request the report using the usual function in ReflexBlue. Then, in the Print Preview, select Edit Layout.
The Report Designer then opens with the same data as in the print preview. This lets you check how the report layout works with the data from your administration.
Change the language of the Report Designer
Use these steps to change the language of the Report Designer user interface.
- Open the ReflexBlue Report Designer.
- In the top-right corner of the title bar, select the current language, such as EN or NL.
- Select the preferred language from the list.
- The Report Designer user interface changes to the selected language.